
-
-
Your monitor's software allows you to adjust the offset and gain from two places: Manual Entry and Calibration.
-
Both are accessed by entering the Calibration and Service app from your Aeroqual Connect of Aeroqual Cloud home screen.
-
-
-
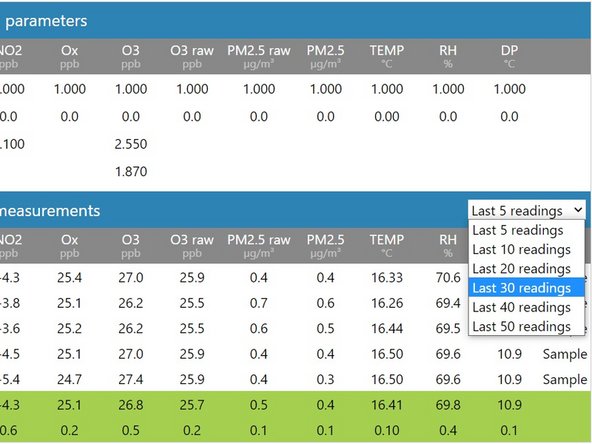
The Manual Entry area displays offsets and gains for all your configured sensors.
-
These are displayed in a Calibration parameters table, along with any additional calibration parameters such as the a value.
-
The a value is associated with the NO2 channel (if you have the Ox/O3 system).
-
-
-
To change the offset, gain or a value for a particular sensor, simply click the cell to select the current value.
-
Type in your new value and when the Save button appears, select it.
-
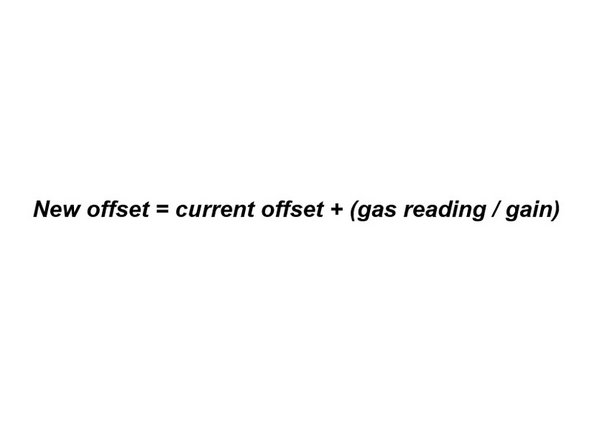
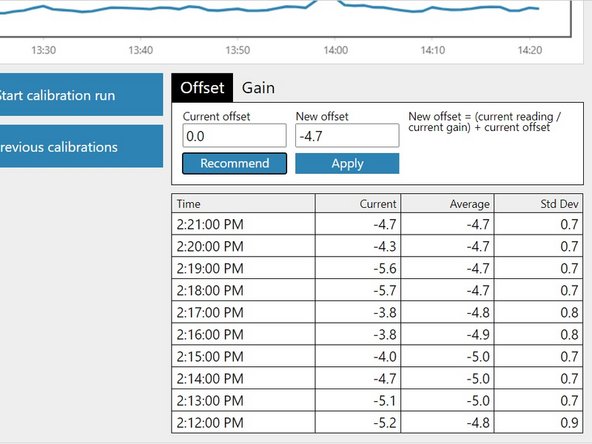
If you're using the Manual Entry area to upload offset adjustments, you need to manually calculate your new offset using the equation shown before making any changes.
-
-
-
The Manual Entry area also shows real-time measurements for all your configured sensors, as well their average and standard deviation.
-
To show more or less readings, and therefore alter the associated average and standard deviation, select a different display option from the drop-down.
-
-
-
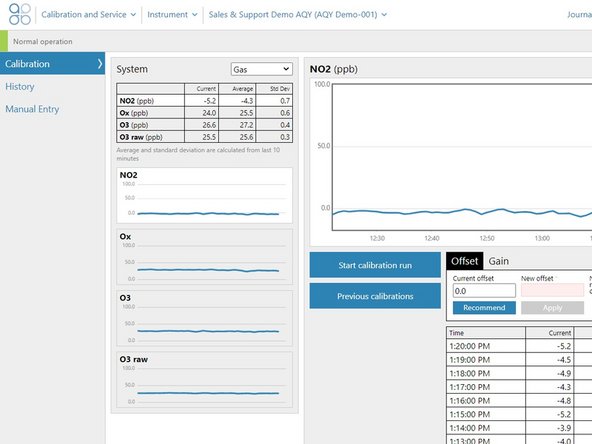
The Calibration area of the Calibration and Service app allows you to focus on a single gas channel while that gas is being calibrated.
-
Select Gas from the drop-down list in the System panel.
-
Click the channel of interest from the list of gas modules.
-
-
-
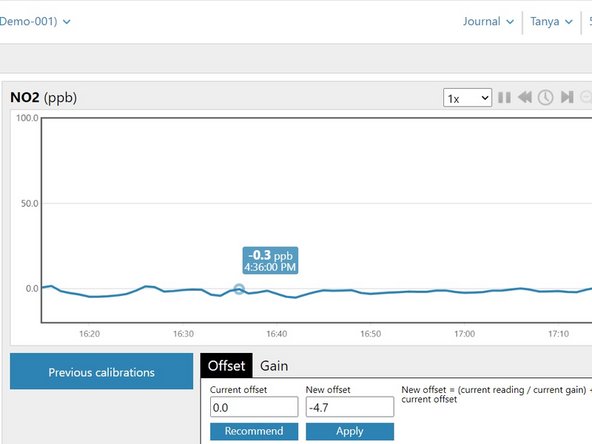
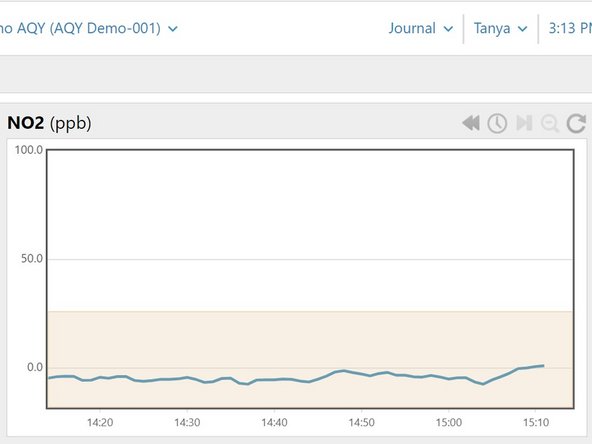
View the response of the gas in a real-time line graph. By default, the graph shows the last 60 readings.
-
Hover your cursor over any point in the line to view the measurement recorded for that minute.
-
-
-
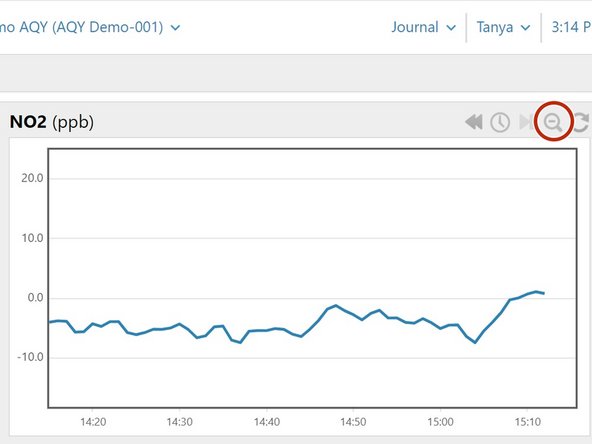
To decrease the increments on the Y axis (and therefore magnify your graph), click and drag your mouse over the area you want to magnify.
-
To zoom back out, click the Zoom out icon on the toolbar.
-
-
-
Click the Recommend button to calculate the offset or gain for your selected gas.
-
Click the Apply button to apply the calculated offset or gain.
-
When the confirmation message appears, select the tick in the title bar.
-
The Calibration area also includes a table that shows the average and standard deviation for the last 10 measurements.
-


For further support, contact Technical Support.
For further support, contact Technical Support.
Cancel: I did not complete this guide.
4 other people completed this guide.
