-
-
Option 1: Enable Wi-Fi on Ranger. As long as Wi-Fi is enabled, all logged data is immediately synchronized to Cloud.
-
Option 2: Manually export the log file via USB, and then synchronize it to Cloud later.
-
Log on to Aeroqual Cloud cloud.aeroqual.com using your logon and password.
-
-
-
From the Aeroqual Cloud home screen, click Manage Data.
-
-
-
From the list of menus on the left-hand side, select Insights
-
Note that Insights is only available for data sampled by Ranger instruments
-
-
-
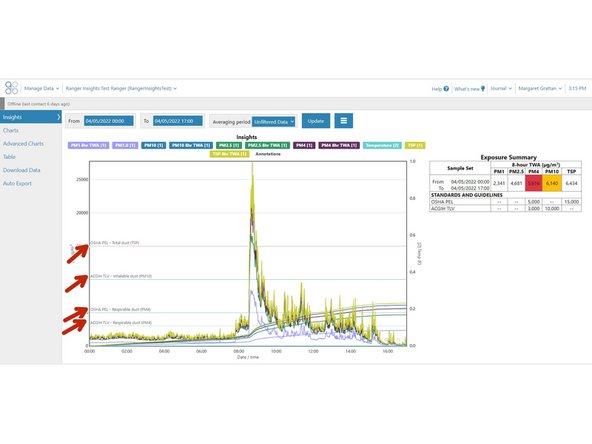
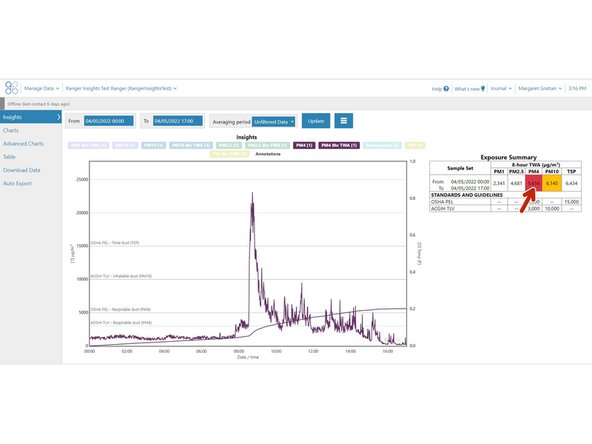
A chart is populated with raw PM values, 8-hour Time-Weighted-Averages, and OSHA/ACIGH limits
-
The OSHA limits are populated using PARTICULATES NOT OTHERWISE REGULATED, TOTAL AND RESPIRABLE DUST (PNOR)
-
The ACIGH limits are populated using Particles (insoluble or poorly soluble) Not Otherwise Specified (PNOS) from the 2022 TLVs and BEIs
-
-
-
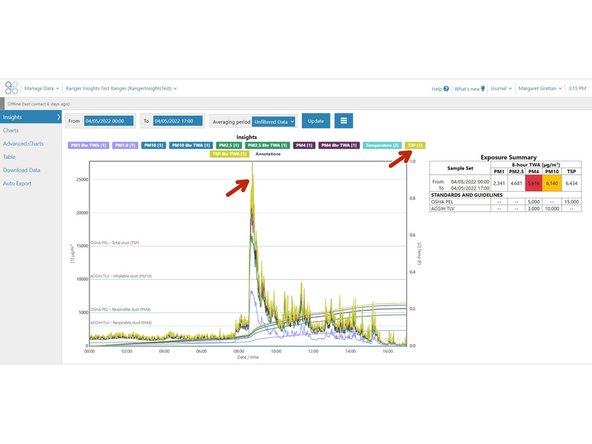
To hide a series from the chart, click on the series name above the chart
-
To unhide a series, click on the series name above the chart once more
-
Raw data averaging will not occur while the Averaging Period displays "Unfiltered Data"
-
-
-
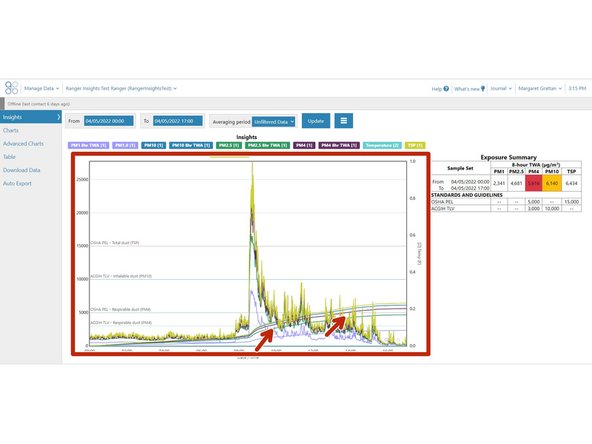
8-hour time-weighted-averages (TWA) are calculated by summing all minute-by-minute samples taken between "From" and x-axis dates/times, and dividing the sum by 480 minutes
-
Take note wherever the 8-hour TWA exceeds a corresponding exposure limit
-
-
-
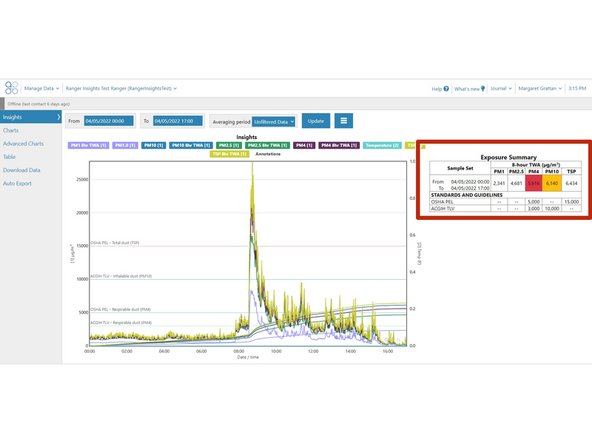
A table appears on the right, summarizing the highest 8-hour TWA reached during the sampling period between "From" and "To" dates/times
-
To visualize key data, hover your cursor above any 8-hour TWA value in the table
-
The chart will hide all series except those that correspond to the value
-
If any 8-hour TWA exceeds one or more corresponding limits, the cell will be colored red
-
If any 8-hour TWA exceeds 50% of one or more corresponding limits, the cell will be colored yellow
-
-
-
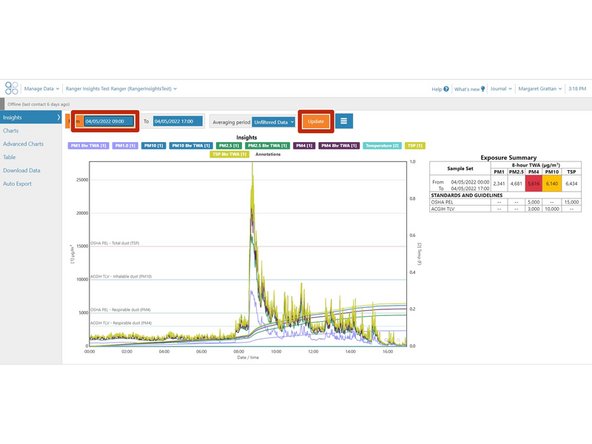
To adjust the dates and times for which you wish to plot data, edit the value in the "From" and/or "To" fields
-
Then click "Update"
-
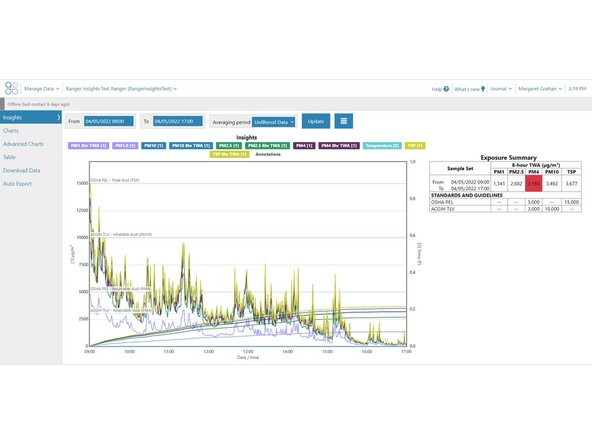
The chart and table are now updated using only data sampled in the period between the "From" and "To" dates/times
-
The 8-hour TWA's have been re-calculated
-


For further support, contact Aeroqual Support.
For further support, contact Aeroqual Support.
Cancel: I did not complete this guide.
One other person completed this guide.