
Introduction
The Live Report provides a real-time, report-style view of contribution data for a project. It allows you to:
- View contribution data in charts and tables
- Monitor site conditions (wind, pollutants, contribution)
- Adjust the time range to analyse recent or historical data
This guide explains how to access and use the Live Report view.
-
-
Go to your project in OneView, and ensure that you have created at least one contribution.
-
You can access the Live Report in multiple ways:
-
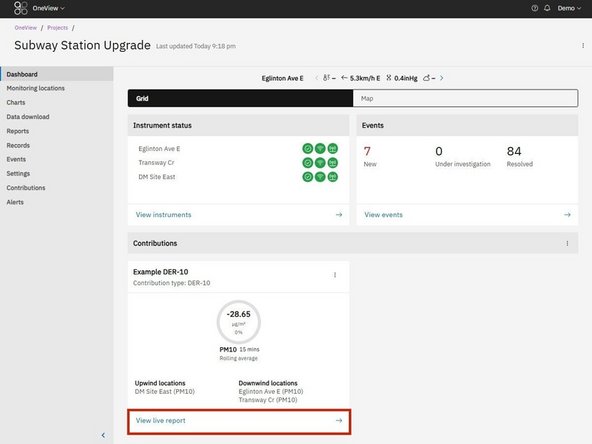
1. From the dashboard: Click “View live report” on a contribution tile
-
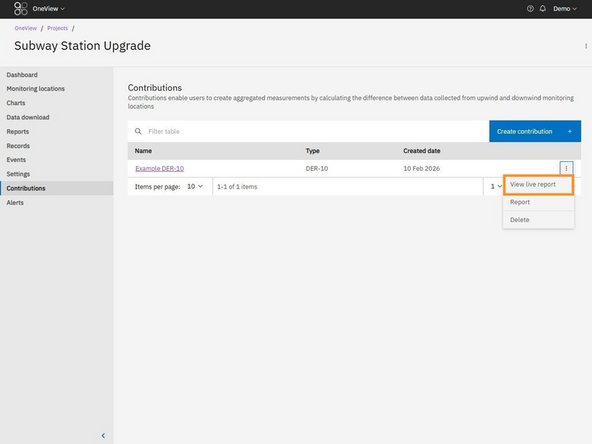
2. From the Contributions table: Click the overflow menu ( ⁝ ) next to a contribution, and select “View live report”
-
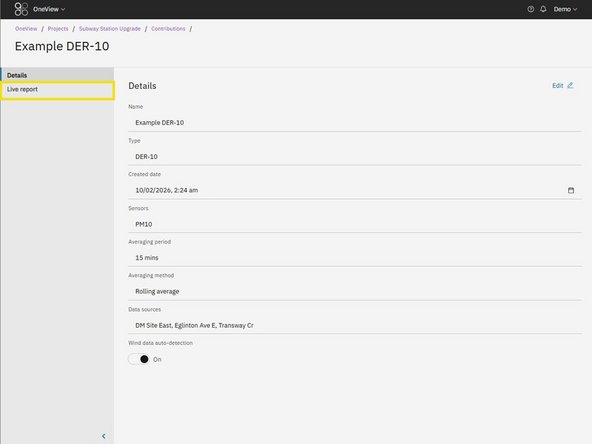
3. From within a contribution: Open a contribution, then select "Live report" from the left hand navigation menu
-
-
-
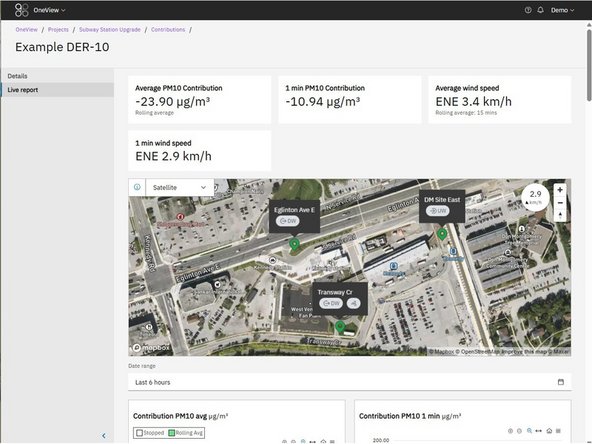
The Live Report displays:
-
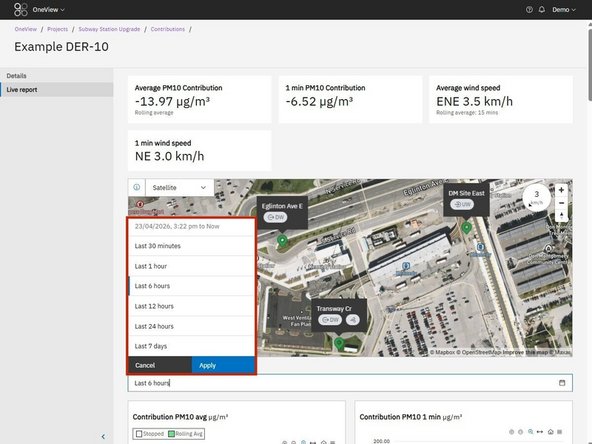
Summary tiles showing current site conditions
-
A map showing monitoring locations and current wind conditions
-
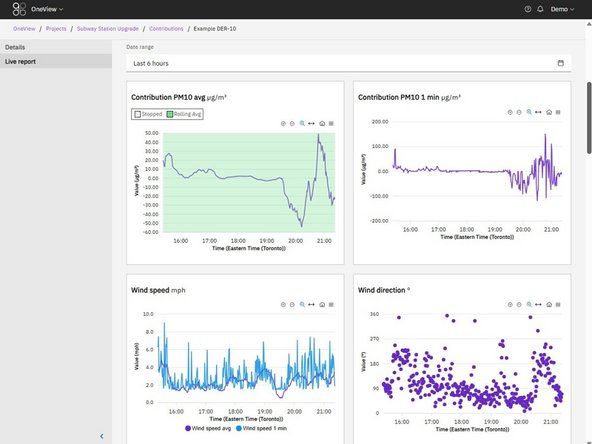
Charts showing contribution, wind, and pollutant data over time
-
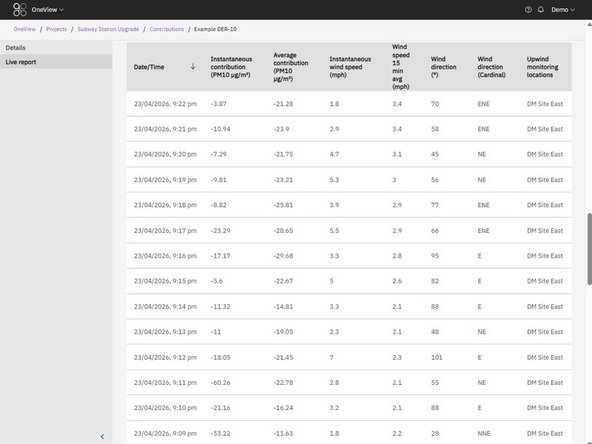
A data table with detailed, timestamped values
-
-
-
Use the Date range selector to control the time period shown in the charts and table.
-
Select a predefined relative range or choose a custom range. The default is the last 6 hours.
-
Note: The date range only affects the charts and data table. The map and summary tiles always display current (live) site conditions, regardless of the selected date range.
-
For further support, contact Aeroqual Support.
For further support, contact Aeroqual Support.
