
-
-
A separate Site Contribution Widget is shown for each site contribution configured in the project. 🔗 Learn how to set up a site contribution.
-
Key Elements:
-
Title: Displays the name of the contribution
-
Subtitle: Indicates the contribution type, such as 1466, DER-10 or Custom.
-
Current Measurement: Shown in the center of the gauge, reflecting the calculated contribution value.
-
Gauge Visualization: Displays how close the current value is to the compliance threshold. 🔗 How to edit compliance thresholds.
-
Wind Locations: Lists the upwind and downwind monitoring locations used in the calculation.
-
Averaging Period & Status: Shows the contribution averaging period (e.g., 2 hours) and status (e.g., Stopped, Initial averaging, Rolling average, or Stopped). 1466 type contributions will show 30 min average during an exceedance event.
-
-
-
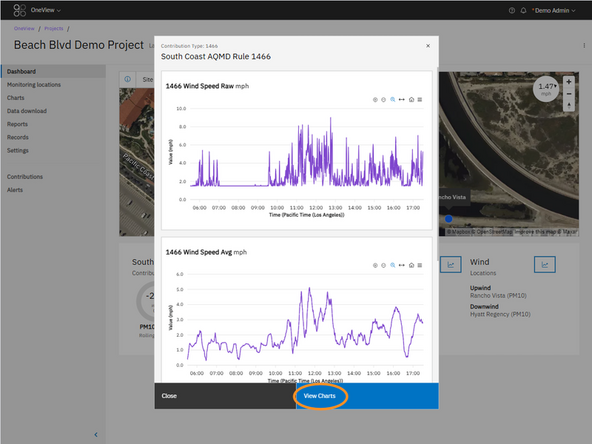
Click the chart icon next to the contribution name to open a modal showing historical chart data for that contribution.
-
A separate chart is generated fro for each contribution data channel.
-
Background shading on the chart indicates the current averaging mode:
-
White: Stopped
-
Blue: Initial Averaging
-
Green: Rolling Avg
-
Pink: 30 min Rolling Avg (1466 exceedance only)
-
Click the View Charts button in the modal to jump directly to the Charting page with the same data channels pre-filtered.
-
-
-
Click the chart icon next to the wind panel to open a modal showing wind data charts for that contribution.
-
Click the View Charts button to jump directly to the Charting page with the same data channels pre-filtered.
-


For further support, contact Aeroqual Support.
For further support, contact Aeroqual Support.
