
-
-
From the Aeroqual Connect or Aeroqual Cloud home screen, click Manage Data.
-
-
-
To view data in chart format, select Charts from the side menu.
-
Select a date range.
-
Select an averaging period.
-
Air quality data readings are taken continuously (minute or sub-minute intervals) and this averages that data over a longer period of time.
-
Click Update.
-
Scroll down to see data for each channel.
-
Hover over point in line to see more information.
-
-
-
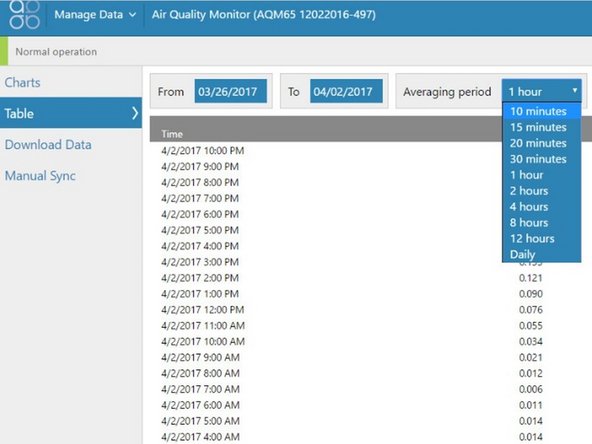
To view data in table format, select Table from the side menu.
-
Select a date range and averaging period.
-
Click Update.
-
Data for each data channel presents in table columns.
-


For further support, contact Technical Support.
For further support, contact Technical Support.
Cancel: I did not complete this guide.
4 other people completed this guide.
