
Introduction
All users with access to Aeroqual Cloud Plus can use our advanced charts feature, if you’d like to know more about getting a Plus licence, please reach out to Sales.
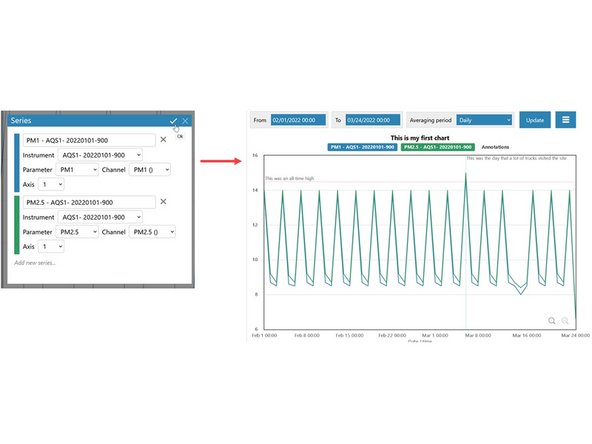
Advanced charts have the ability to show data for multiple channels and/or multiple monitors on the same chart.
These charts can also be saved, which means you can return to them at any time to easily view updated data for your chosen chart configuration.
This guide covers chart creation and annotation. Visit this page to learn about displaying data from multiple channels.
-
-
From the Aeroqual Cloud home screen, click Manage Data.
-
-
-
Select New chart… under Advanced Charts in the side menu.
-
Select an existing chart collection or create a new one in the Group field.
-
Specify a chart name and select a channel or all channels.
-
When the Instruments field appears, select your monitor.
-
Click the tick icon to save (and view) your chart. Once saved, you can return to the chart at any time to view updated data.
-
-
-
If needed, edit the date range for the data and click Update.
-
If needed, edit the averaging period for the data and click Update.
-
Air quality data readings are taken continuously (minute or sub-minute intervals) and this averages that data over a longer period of time.
-
The icons at the bottom-right of the chart allow you to Zoom in/out and annotate the chart on the x & y axes.
-
-
-
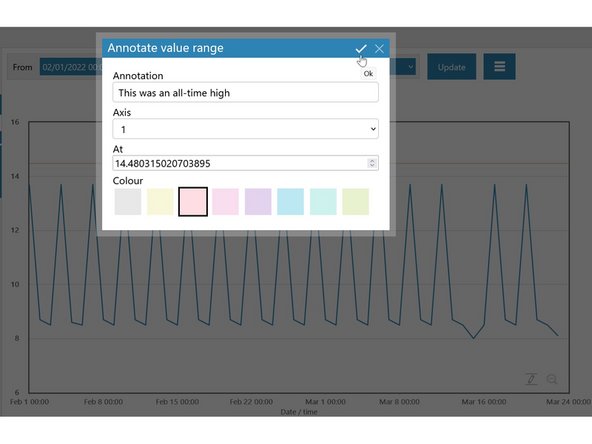
Advanced charts allow you to annotate key moments in time and visualise exceedance levels.
-
You can access these tools by navigating to the bottom right corner, hovering over the magnifying glass and then selecting one of the pencil icons
-
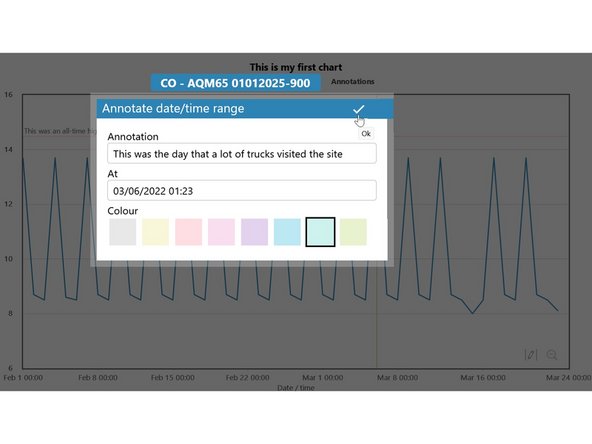
Each icon will allow you to either annotate points on either the X-axis (date/time) or Y-axis (value range).
-
Along with choosing what you'd like your annotation to say, you're also able to assign a colour as well, making it even easier to distinguish between categories of events.
-
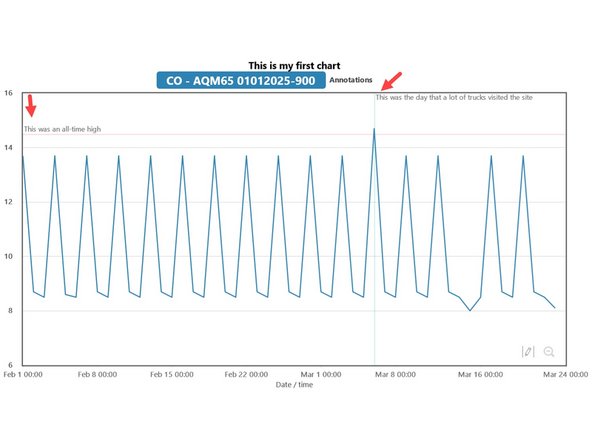
Once you're done, click on the tick icon to save your annotation and view your changes.
-
-
-
If you'd like to change something about your annotation, simply click anywhere on the annotated text or the intercept to open the annotation dialogue box. Once open, make any changes you need and click save.
-
If you'd like to remove your annotation, click on your annotation and then select Remove this annotation.
-
-
-
Now you have an advanced chart you can revisit at any time and continue to annotate if and when there's anything you'd like to add to it.
-
-
-
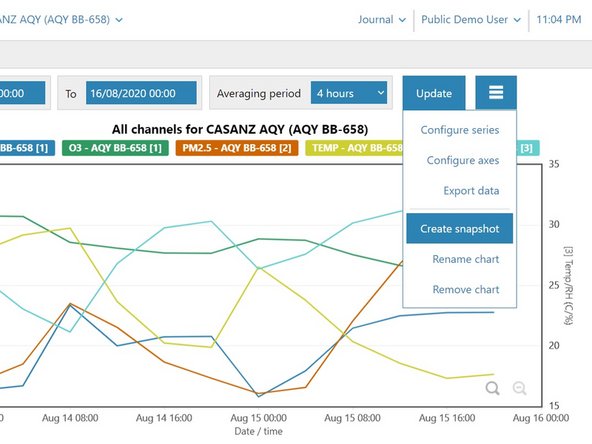
If you'd like to learn more about configuring multiple series, creating snapshots of created charts, or using advanced charts to analyse data across multiple monitors, please visit this page to learn more about what's possible with Advanced Charts.
-


For further support, contact Aeroqual Support.
For further support, contact Aeroqual Support.
Cancel: I did not complete this guide.
One other person completed this guide.