
Introduction
If you have Aeroqual Cloud, you can use the advanced charts feature to show data for multiple channels and/or multiple monitors on the same chart.
Advanced charts can be saved, which means you can return to them at any time to easily view updated data for your chosen chart configuration.
-
-
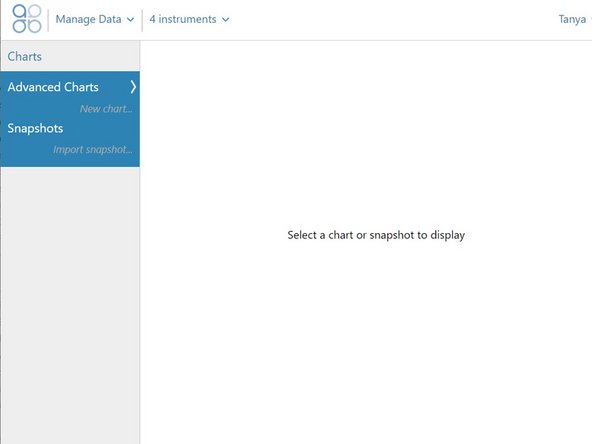
From the Aeroqual Cloud home screen, click Manage Data.
-
-
-
To create a chart that shows 2 or more channels from the same monitor, go into Instrument mode for your chosen monitor.
-
Select New chart… under Advanced Charts in the side menu.
-
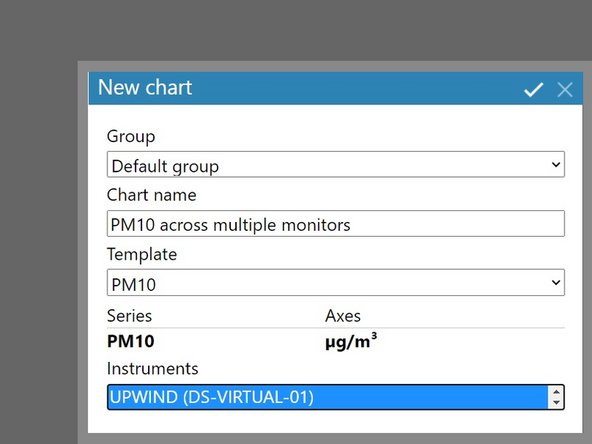
Select an existing chart collection or create a new one in the Group field.
-
This chart will be saved under this group name in the side menu.
-
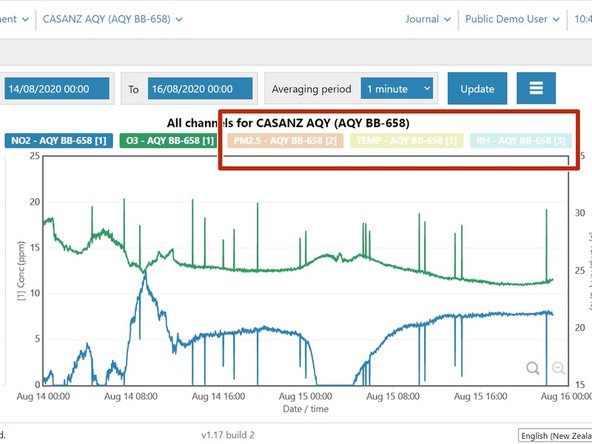
Specify a chart name and select a channel or all channels.
-
When the Instruments field appears, select your monitor.
-
Click the tick icon to save (and view) your chart. Once saved, you can return to the chart at any time to view updated data.
-
-
-
To hide a channel, click the channel in the header area of the chart. It displays as a lighter shade.
-
To show a hidden channel, click it again.
-
-
-
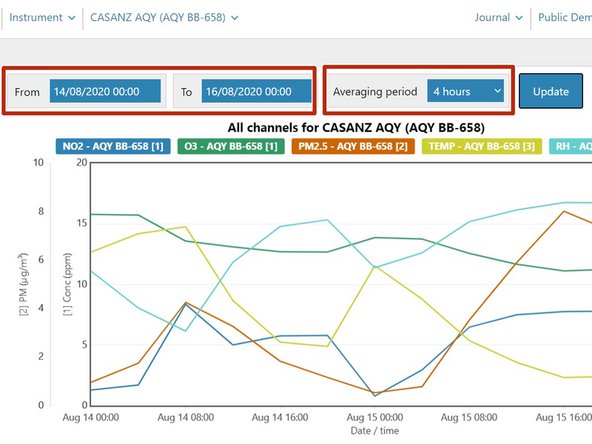
If needed, edit the date range for the data and click Update.
-
If needed, edit the averaging period for the data and click Update.
-
Air quality data readings are taken continuously (minute or sub-minute intervals) and this averages that data over a longer period of time.
-
-
-
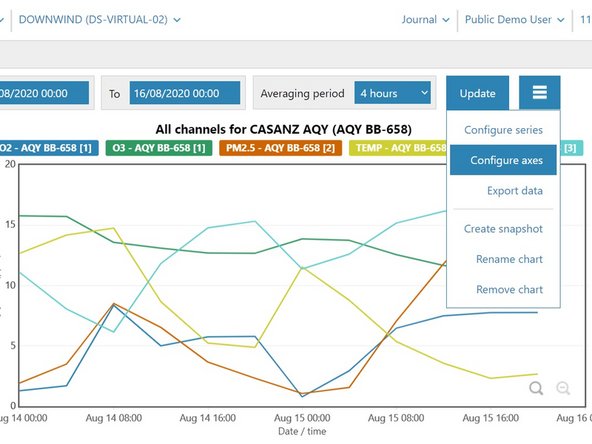
To change the axes, select Configure axes from the options menu.
-
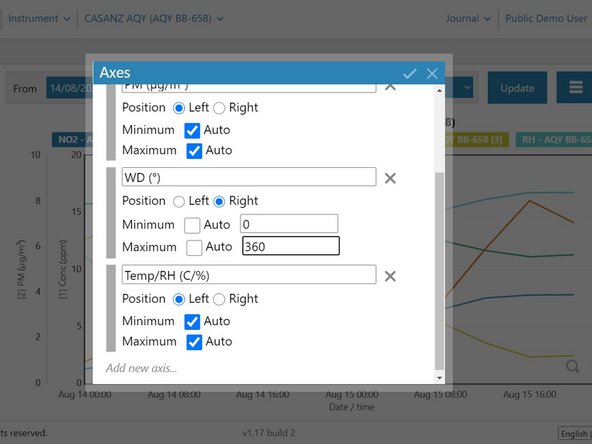
From the Axes dialog box, you can:
-
Edit the axes text.
-
Change the position of the axes text (either left or right).
-
Change the minimum and maximum values of the axes (uncheck Minimum and Maximum and enter values in the popup fields) or use the automatic axes value selection (check Minimum and Maximum and enter values).
-
Add a new axis.
-
Delete an axis.
-
-
-
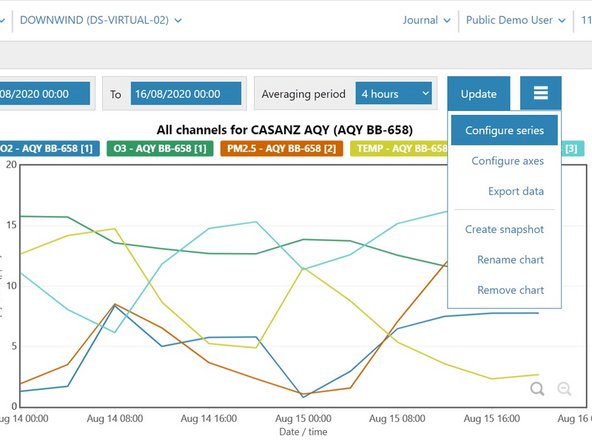
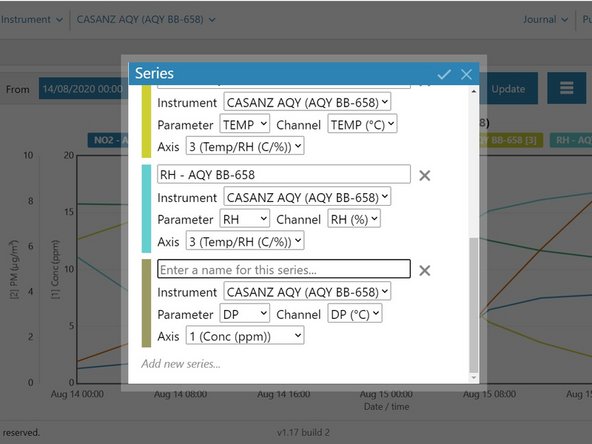
To change the series (channels) shown in the chart, select Configure series from the options menu.
-
From the Series dialog box, you can:
-
Rename a series.
-
Change the measurement type a series is using.
-
Remove a series.
-
Add a new series.
-
-
-
To rename the chart, select Rename chart from the options menu.
-
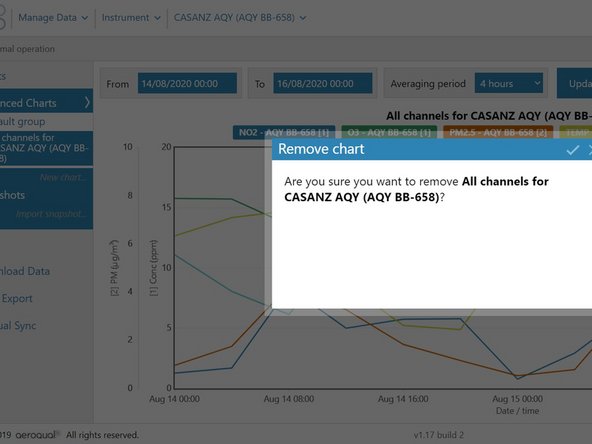
To delete the chart, select Remove chart from the options menu.
-
-
-
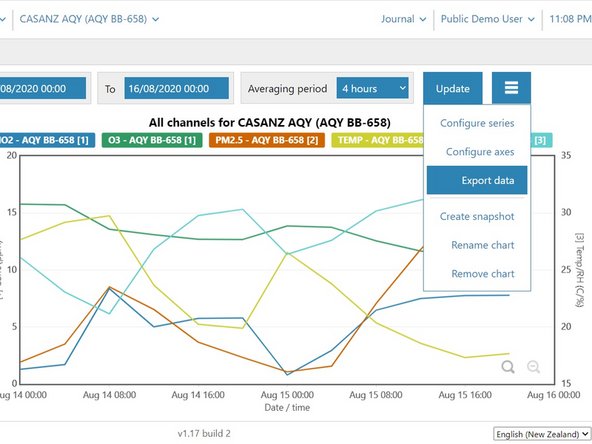
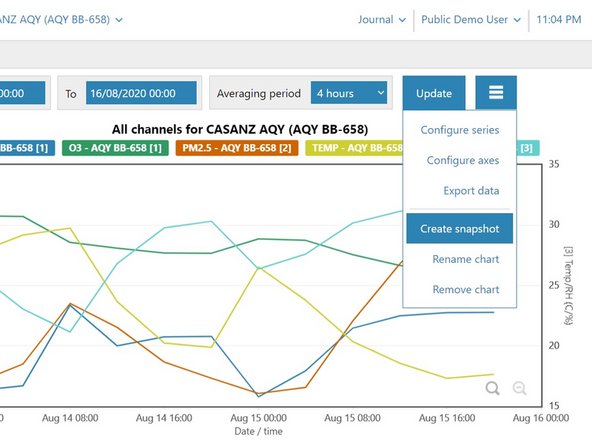
To export chart data for analysis and manipulation, select Export data from the options menu.
-
The file format is comma-separated values (.csv), which is easily opened in Microsoft Excel.
-
-
-
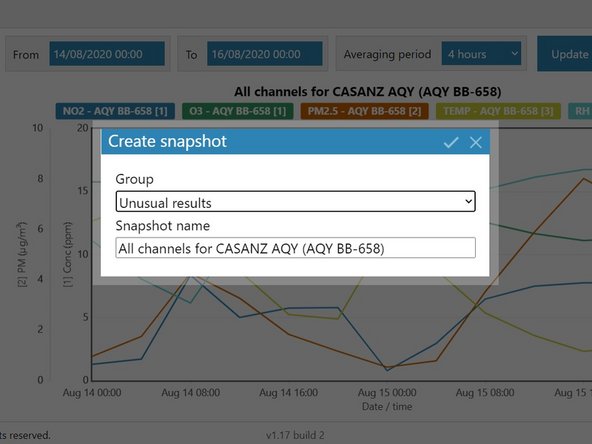
To take a copy of an advanced chart and share it with someone else, select Create snapshot from the options menu.
-
When the Create snapshot dialog box appears, select or create a group and give the snapshot a name.
-
Click the tick icon to save the snapshot in the Snapshots section of your side bar.
-
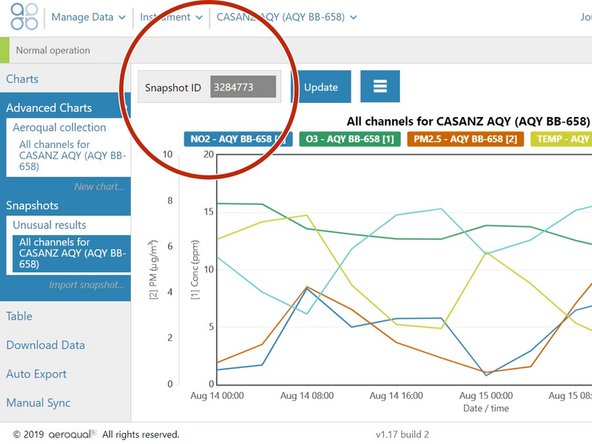
Copy the snapshot ID and email it to the person you want to share the chart with.
-
The person must be an Aeroqual Cloud user and have access to Advanced Charts in order to import the snapshot using the snapshot ID. Once imported, they can hide channels but they can’t manipulate the data (there are no date range fields, no averaging period drop-down, and no options menu for configuring the chart).
-
-
-
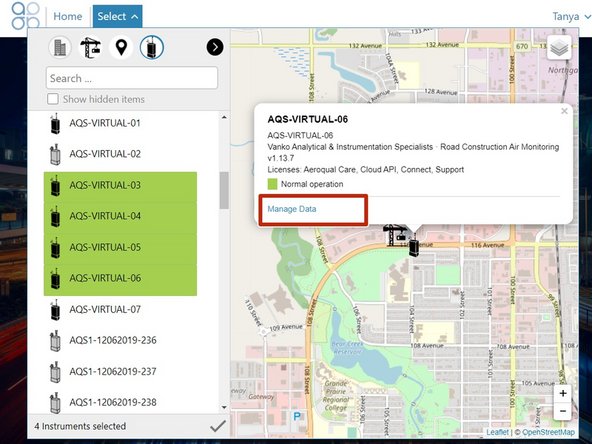
To create a chart that shows data for 2 or more monitors, use the Search panel to find and select the monitors.
-
Once the monitors are selected, click Manage Data from the details popup.
-
Select New chart… under Advanced Charts in the side menu.
-
Complete the Series dialog box, holding down your [Shift] key to select 2 or more monitors in the Instrument drop-down.
-
Click the tick icon to view your chart.
-
If you want to edit or add another channel for any of the selected monitors, select Configure series from the options menu.
-
-
-
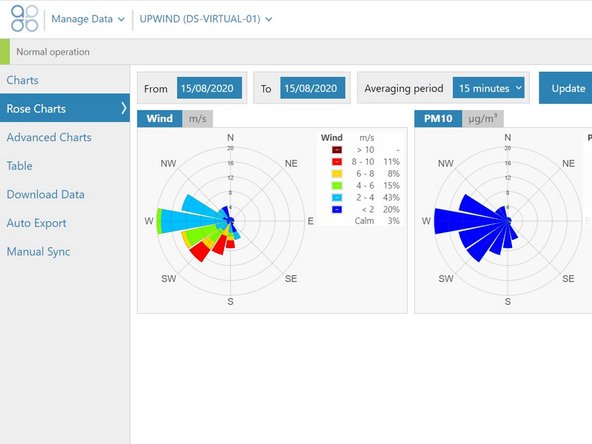
If you have access to the Advanced Charts feature and the monitor uses a sensor to measure wind speed and wind direction, the Rose Charts option shows in your side menu.
-
To generate a rose chart, simply select Rose Charts in the side menu.
-
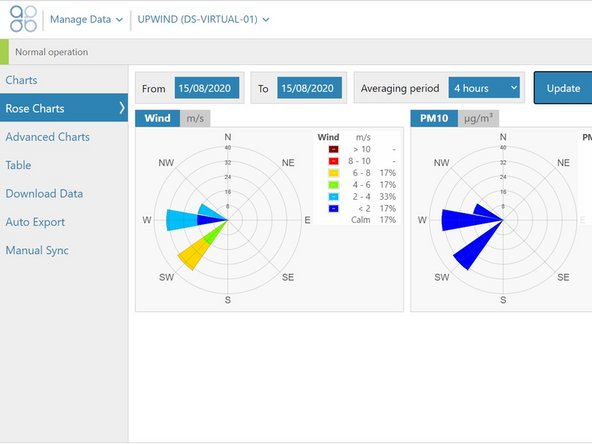
If needed, edit the date range for the data and click Update.
-
If needed, edit the averaging period for the data and click Update.
-


For further support, contact Technical Support.
For further support, contact Technical Support.
Cancel: I did not complete this guide.
2 other people completed this guide.
